Qubes Survey: The Results
Hello, lovely Qubes Community!
A couple of weeks ago, we asked you to participate in a survey; to our delight and surprise, over 2100 of you decided to help us and filled it out! We are grateful for our wonderful community and wanted to share some interesting findings from the survey with you. A small statistical note: a survey such as this, on a non-random and very much self-selected sample, is not necessarily completely representative of the whole community. It’s quite possible that the people whom we did not reach and the people who decided not the participate in the survey differ in statistical ways from those we did survey, so please understand all of the “community members say X” statements below as having a little asterisk with “as far as we know based on this survey”.
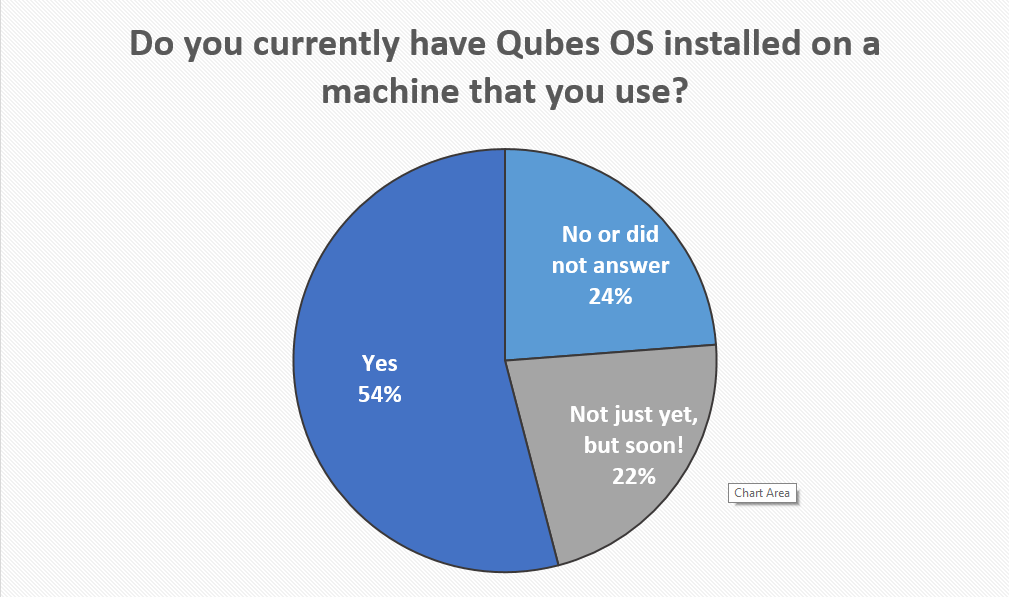
Some introductory stats: 54% percent of our respondents have Qubes installed, and 22% are planning to.
Most of them are expert computer users to varying degrees, but 1% said that they prefer not to use computers when they don’t have to. Seeing the state of security in the wide computer world, sometimes we’re tempted to agree.
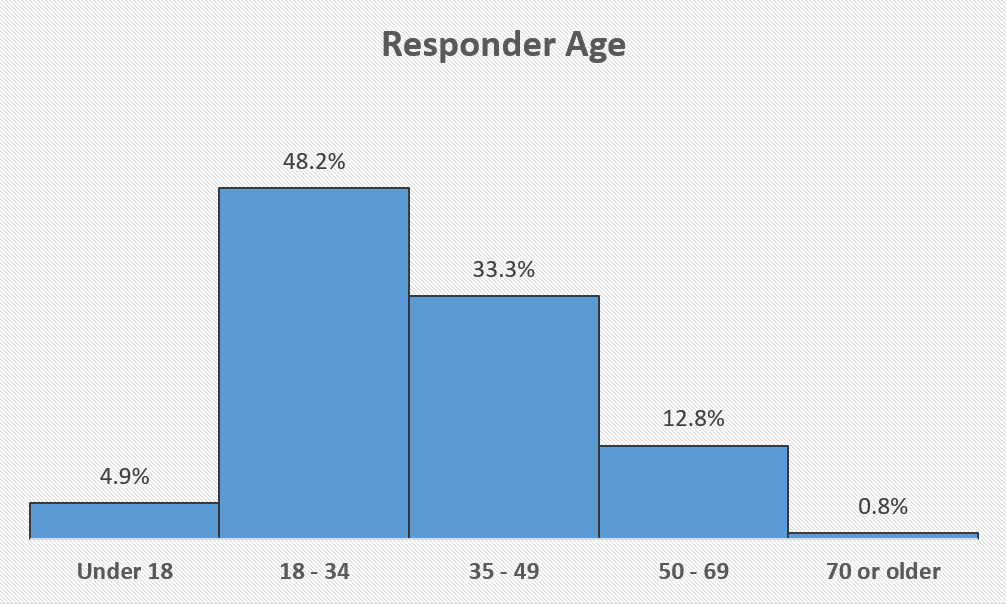
It also turned out that our community has a fairly unsurprising age spread, with almost half (43%) of the respondents between 18 and 34 and a third (31%) between 35 and 49. There are people over 70 and under 18 among us, too.
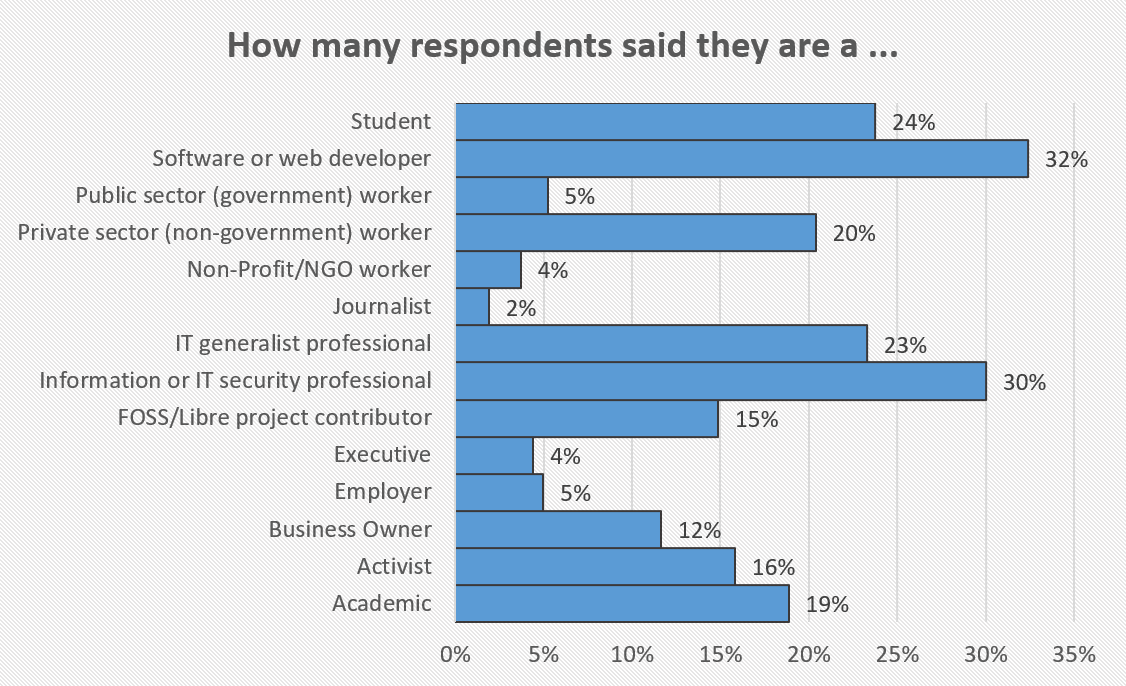
About one-third of the respondents are developers (which is in line with what we anticipated — after all, Qubes is a pretty technical piece of software), and IT professionals of all sorts are about sixty percent of the respondents. We also have a strong contingent of academics (19%) and activists (16%).
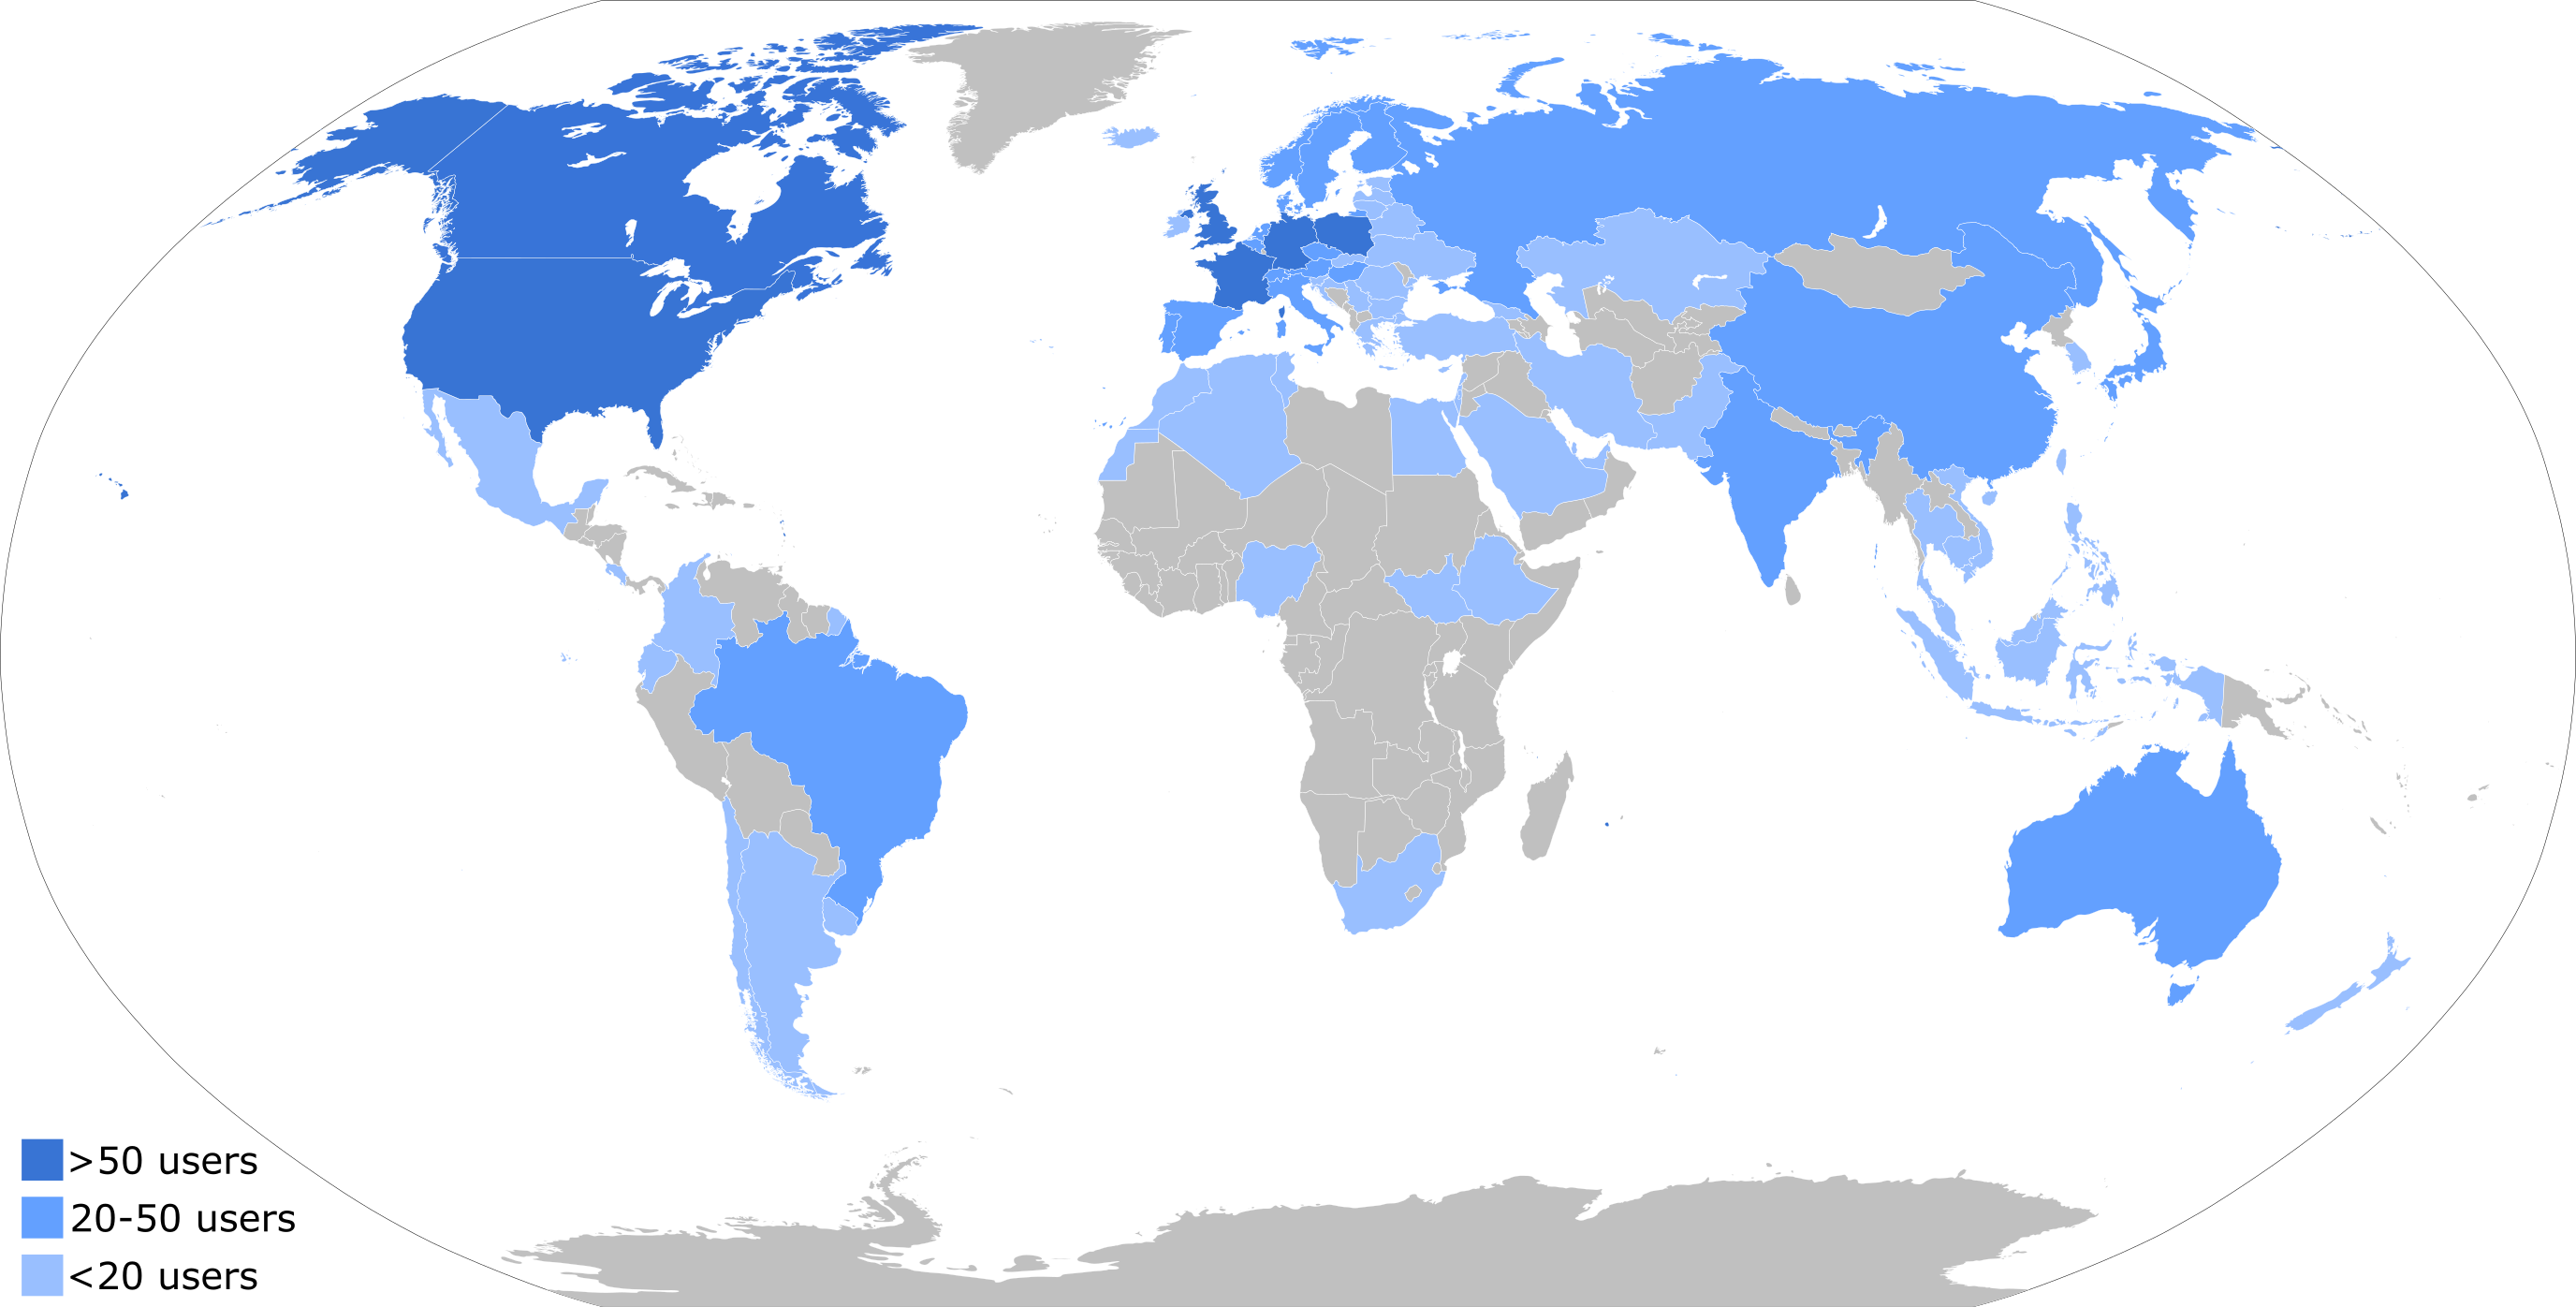
For privacy reasons, we won’t be sharing a detailed breakdown of where our users are located, but we made a map with countries colored based on how many Qubes users are there, for your and our enjoyment. Note: the map is based on Wikipedia’s map of the world. Please forgive any inaccuracies in it.
While doing the data crunching, I was a bit fascinated by three large groups of people: those from capital cities just putting down the name of the capital (omitting the country name), people in the US replying with just the name of their town (I’ve learned a lot about small American towns!) and people in the UK clarifying they are not English, thank you very much. I had to smile at “United Kingdom of England and Some Actually Good Countries”.
We’re very interested in the hardware people are using and want to use with Qubes. Hardware is always a difficult subject for us, as there’s a lot of possible combinations and not nearly enough manpower to test and fix bugs for all of them, and we want to know where to focus our resources. This intuition was well confirmed by the survey: hardware compatibility was something a lot of people mentioned in the “reasons for not using Qubes/reasons for stopping using Qubes” questions.
Following the common trend in modern hardware, most people use laptops or laptops and desktops equally (only 22% of our respondents use mostly a desktop computer), and most Qubes users tend to use it on a laptop (63% of them in the survey). A lot of people use external monitors with their laptops (over 55% of laptop users), and we know an external monitor can be tricky to use with Qubes, leading to all sorts of annoying problems with layout or input detection. (If you haven’t yet tried it, take a look here: Qubes GUI Troubleshooting). A significant number of respondents also say they use cameras (36%) and microphones (60%). It makes me wonder what the responses to this question would be a year ago, before so many of us started working remotely.
As far as desired Qubes localization goes, there were few surprises, with the overwhelming majority preferring English (for a survey in English, it’s hard to be shocked by this result), and the next places being taken by German (over 200 votes), French (over 120 votes), Spanish (over 80) and Russian (over 70). One impressive polyglot said they use a different language in each AppVM to easily distinguish their working environments, and I have to say, I wish I spoke enough languages to achieve that!
We asked about the OS our respondents find most comfortable, and, clearly, most prefer using Linux (48%), with Windows and Qubes (about 21% each) close seconds. Finally, there’s little love for Mac OS, with less than 10% of respondents listing it as “most comfortable”. Among Linux users, the range of distributions wasn’t very surprising, with Debian and Ubuntu as clear leaders, with over 50% selecting each as the distribution they use.
We also asked about the distribution you would prefer as the default template for AppVMs. Debian got over twice as many votes (686) as the runner-up, Fedora (336). Sounds like a good moment to mention that in Qubes 4.1 you can choose the default template at install (currently between Fedora and Debian). Arch Linux (third place, with 74 people writing it in as ‘Other’) is also available as a community template and is well-maintained. Interestingly enough, just using a distribution doesn’t mean someone wants to use it as the default template in Qubes, with some distributions having much more ardent supporters. 82% of people who use Debian want it as the default template, which is not that surprising, as Debian was one of the options explicitly offered in the “default distro” question. But also almost 50% of NixOS users want it as the default template, which even from a purely methodological point of view is a lot, as they had to explicitly write this distribution down in the second question. NixOS has some very devoted users! On the other hand, although Ubuntu was one of the most popular distributions, only 4% of its users wrote it as their preferred default distribution…
| Distribution | Users | Want it as default template |
|---|---|---|
| Debian | 1103 | 82% |
| Ubuntu | 928 | 4% |
| Fedora | 783 | 55% |
| Arch Linux | 438 | 23% |
| CentOS | 265 | 6% |
| Gentoo | 86 | 34% |
| NixOS | 46 | 46% |
(This table contains only the most popular choices, not all answers.)
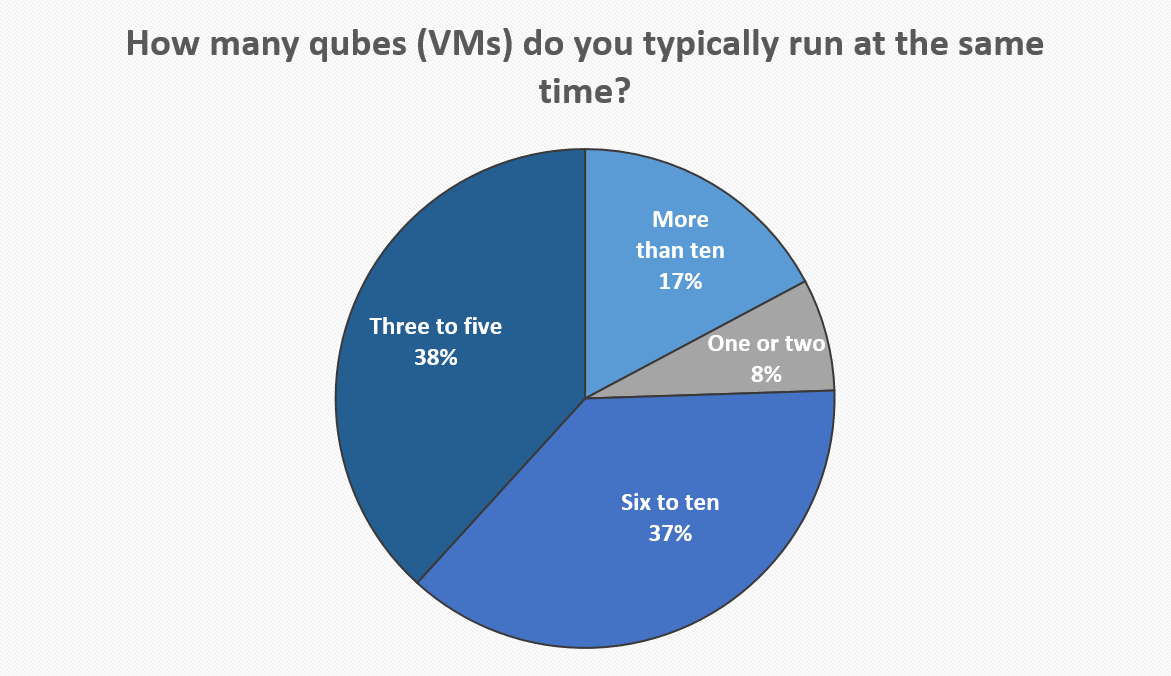
From a UX development point of view, a particularly important question for us was “How many qubes do you typically run at the same time?” Turns out that about the same number of people run 3-5 qubes as 6-10 (about 38%). This will definitely be a huge help in future development of the various Qubes tools and widgets. It’s also a bit more than we suspected before!
As far the “how did you learn about Qubes” questions go, I think the conclusion on my side (as one of the authors of the survey) is simple: I really should have just included a “from Edward Snowden” option there, which would have saved our respondents some typing!
The survey covered many more questions than are described above, and they are all important for us as a team to learn more about you, our users, to know what to focus on and what to work on, what will work best and what may not be a great idea. Don’t worry. If a question isn’t discussed above, we have still read it! And again, thank you everyone for participating (and the many, many kind words you shared in your surveys).
